Phase Projection
This function permits the calculation of a phase projection diagram for a system with two or more components. PanEngine automatically searches the univariant phase projection lines.
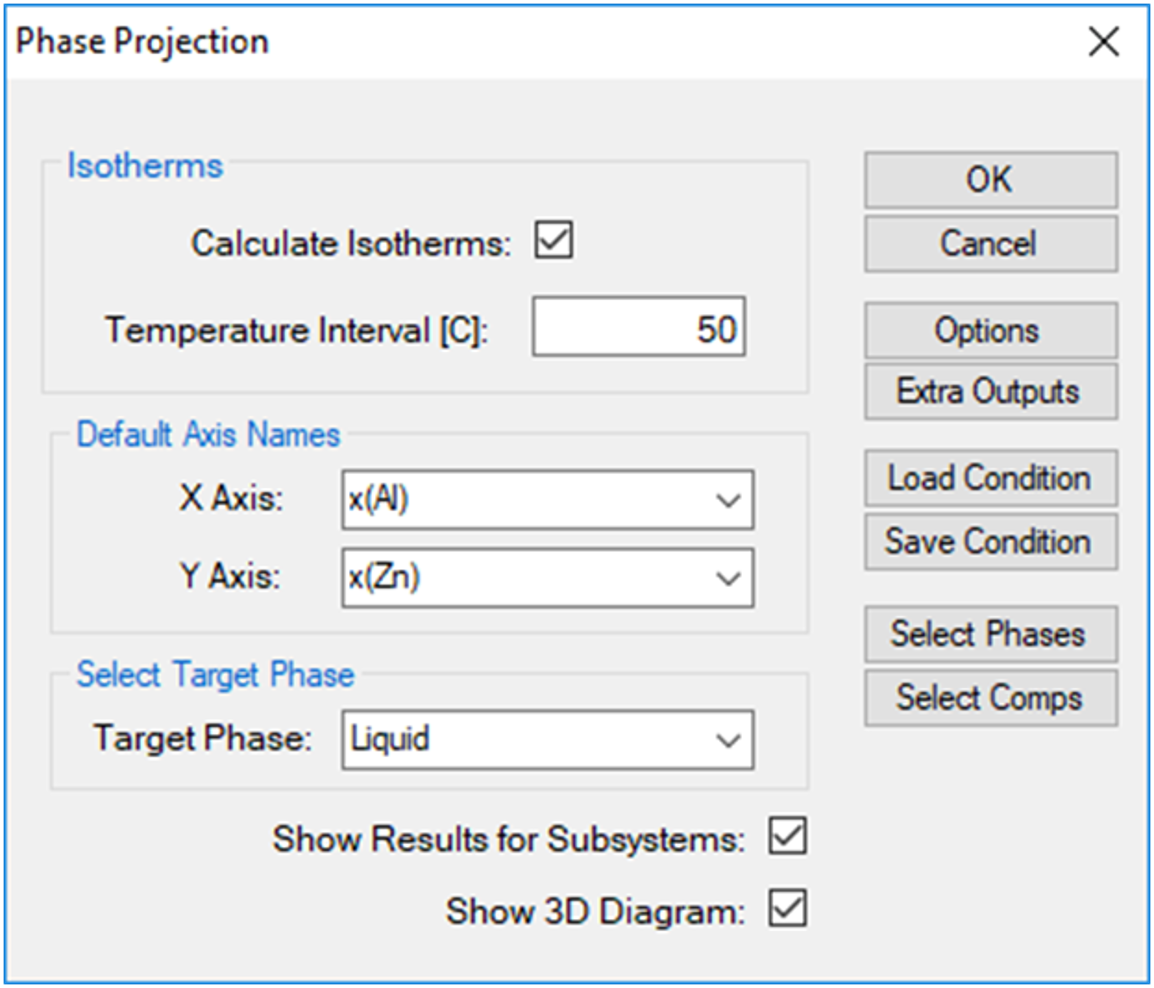
Go to PanPhaseDiagram on the menu bar and select Phase Projection or Click the ![]() button on the tool bar. The Phase Projection dialog box shown in Figure 1 allows the user to calculate projection of any phase in the system. If “Liquid” is selected as Target Phase, liquidus projection for the system is calculated. Isothermal curves involving the selected phase in a ternary system can also be calculated by checking the box Calculate Isotherms. The density of isothermal curves depends on the scale of Temperature Interval. A larger value for the temperature interval leads to fewer isothermal curves but with faster speed of calculation. The default Compositional Range is full range for each component. User can define the default output graph by selecting the X and Y axis. User can also access the Options, Extra Outputs, Load Condition, Save Condition, Select Phases, and Select Comps windows through this dialog box. If the Show Results for Subsystems box is checked, the output files will include the results for the subsystems together with the multicomponent system. Be aware that the output table will be huge if the box is checked for a calculation with a higher order multi-component system. User can choose the specific phase for projection calculation in the Target Phase dialog, such as Fcc phase. If “*” is selected, the projection for all the phases will be calculated. If the Show 3D Diagram box is checked, there will be an extra 3D diagram showing the calculation results as well as the original 2D diagram. For the 3D diagram, user can rotate the diagram by holding the left button of mouse and move it around.
button on the tool bar. The Phase Projection dialog box shown in Figure 1 allows the user to calculate projection of any phase in the system. If “Liquid” is selected as Target Phase, liquidus projection for the system is calculated. Isothermal curves involving the selected phase in a ternary system can also be calculated by checking the box Calculate Isotherms. The density of isothermal curves depends on the scale of Temperature Interval. A larger value for the temperature interval leads to fewer isothermal curves but with faster speed of calculation. The default Compositional Range is full range for each component. User can define the default output graph by selecting the X and Y axis. User can also access the Options, Extra Outputs, Load Condition, Save Condition, Select Phases, and Select Comps windows through this dialog box. If the Show Results for Subsystems box is checked, the output files will include the results for the subsystems together with the multicomponent system. Be aware that the output table will be huge if the box is checked for a calculation with a higher order multi-component system. User can choose the specific phase for projection calculation in the Target Phase dialog, such as Fcc phase. If “*” is selected, the projection for all the phases will be calculated. If the Show 3D Diagram box is checked, there will be an extra 3D diagram showing the calculation results as well as the original 2D diagram. For the 3D diagram, user can rotate the diagram by holding the left button of mouse and move it around.
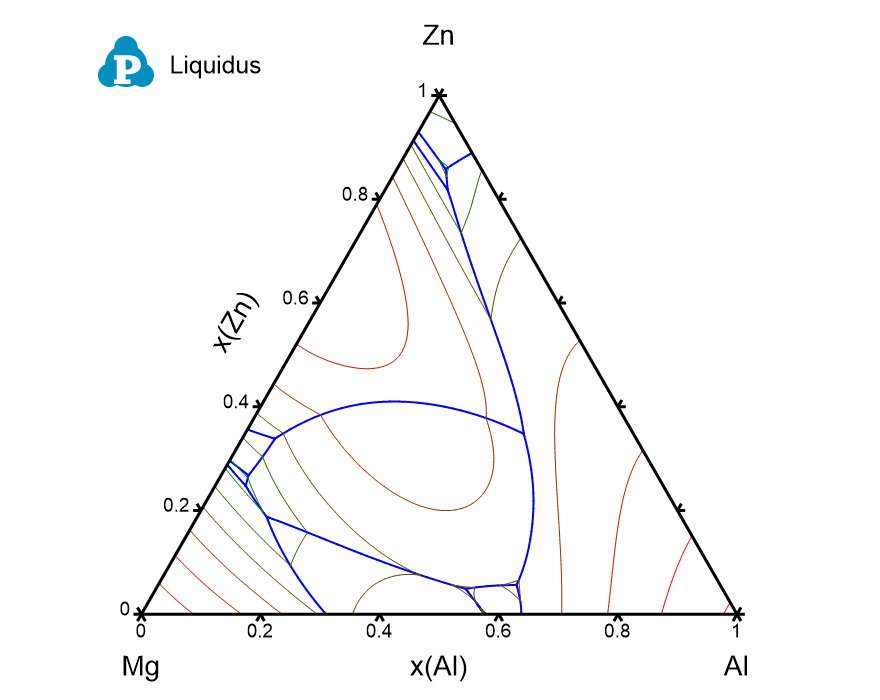
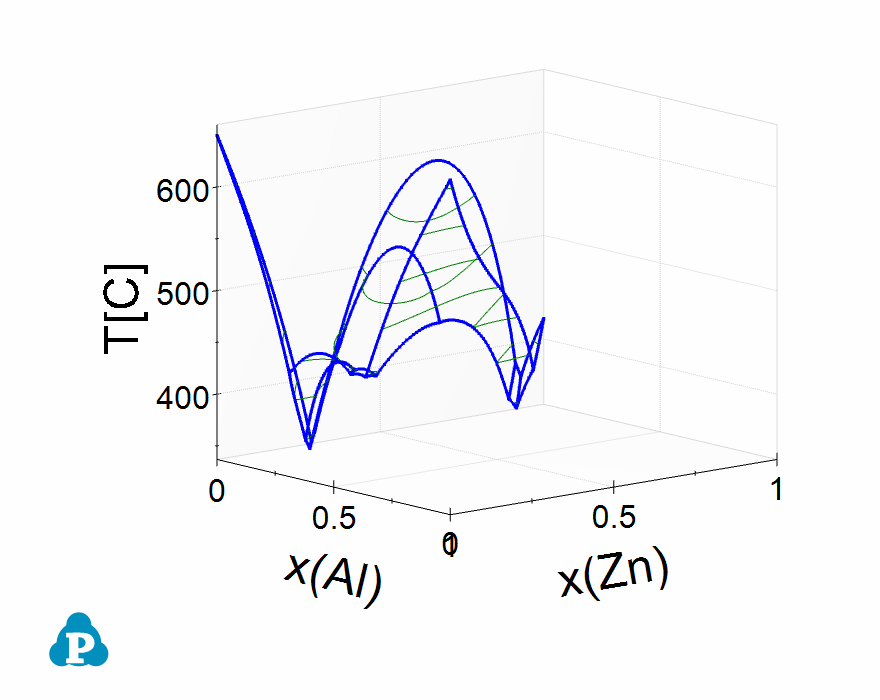
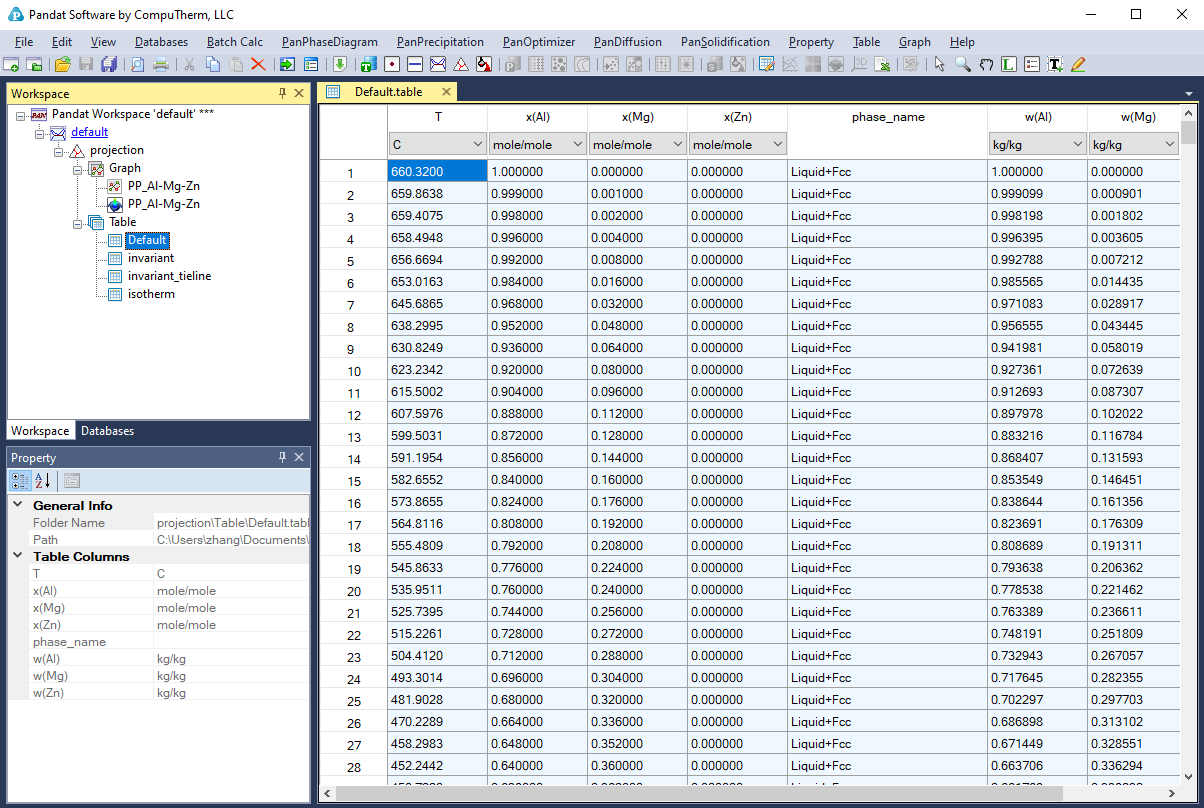
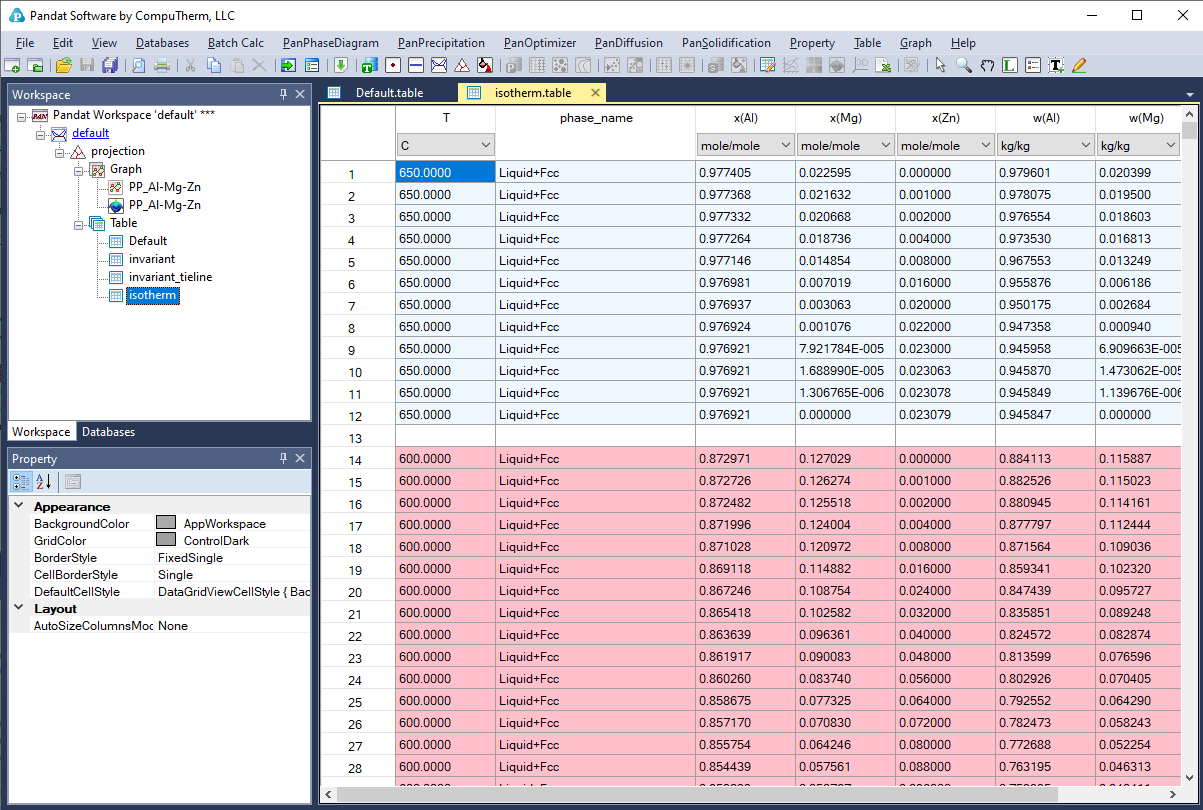
The results from a liquidus projection calculation are displayed in two types of format in the PandatTM main window: Graph and Table. Figure 2 to Figure 5 show the 2D and 3D graph view, default table and isotherm table for the liquidus projection calculation results, respectively. user can switch between Graph view to Table View by double clicking on the graph name or the table name in the PandatTM Workspace window. Extensive operations on Graph and Table, such as labeling and adding legend, have been discussed in detail in Section Graph and Section Table.